
We’re excited to announce release 24, the latest evolution of our AI-driven observability platform.
Here’s what’s new:
- The Nectar DXP MCP Server is generally available in every environment
- The first full SBC platform view in DXP
- CX Assurance and DXP are now one operational surface
- Google Meet joins WebRTC platform coverage
- Auto-location now works across every platform DXP supports
- A new Conversation Journey type for Nectar Diagnostics Platform
- User mapping, and stability improvements
MCP Server for AI Integration Is Now Generally Available
Every DXP environment now includes a built-in MCP server. There’s nothing to deploy, install, or request.
Until now, the observability data inside DXP was reachable two ways: through the UI, or through a custom integration someone had to build. With R24, any MCP-capable AI assistant or agent a customer authorizes can query live DXP data directly, call quality, device health, alarms, session diagnostics, and more, with no custom integration required.
It matters beyond DXP too. Major observability platforms are shipping MCP servers for the same reason, and Microsoft and AWS are building MCP into their agent ecosystems. Those systems can give an AI agent deep visibility into infrastructure, applications, logs, and incidents, but they can’t tell it why a Teams call was bad, why a contact center interaction failed, or whether a trunk or SBC is saturated. That context has to come from somewhere, and now it can come from Nectar.
Practically, that means DXP no longer has to be the place someone goes to find the answer. It can supply the answer, in context, to whatever AI assistant or agent a company is already working in. Ask “Why did calls into the Dallas contact center degrade this morning?” and an agent can combine what it knows about the infrastructure with what Nectar knows about the actual communications experience to answer directly. AND access stays exactly as governed as it is today. AI tooling can’t see anything a user couldn’t already see themselves in DXP, since every connection runs through that user’s own authentication, permissions, and tenant.
SBC Monitored Dashboards and Reporting: All in One Place
Session Border Controllers are the gatekeepers for all SIP traffic, and often the most business-critical device in the stack. Until now, they’ve also been a blind spot: when calls failed, DXP showed the symptom, but finding the cause meant logging into separate vendor tooling.
R24 closes that gap with the first full SBC dashboard in DXP. Built on the Foundation Oracle SBC scripted VKM, the new screen brings SBC health into the same operational surface teams already use for every other platform. Alongside it, a new resource usage report spans all three major SBC platforms, Oracle, Ribbon, and AudioCodes, for the estate-wide view that capacity planning and QBRs need.
Why it matters
- Hardware problems surface early. Overheating, failing components, and rising load show up while there’s still time to act, whether that’s scheduling a repair or planning more capacity.
- Outages become preventable, not reactive. Expiring certificates, capacity limits, and failover gaps are flagged with enough lead time to fix before customers ever notice.
- Root cause is immediate, not a hunt. When calls fail, teams can see exactly which trunk, peer, or component is responsible instead of piecing it together from separate tools.
CX Assurance and DXP: Unified Testing and Monitoring
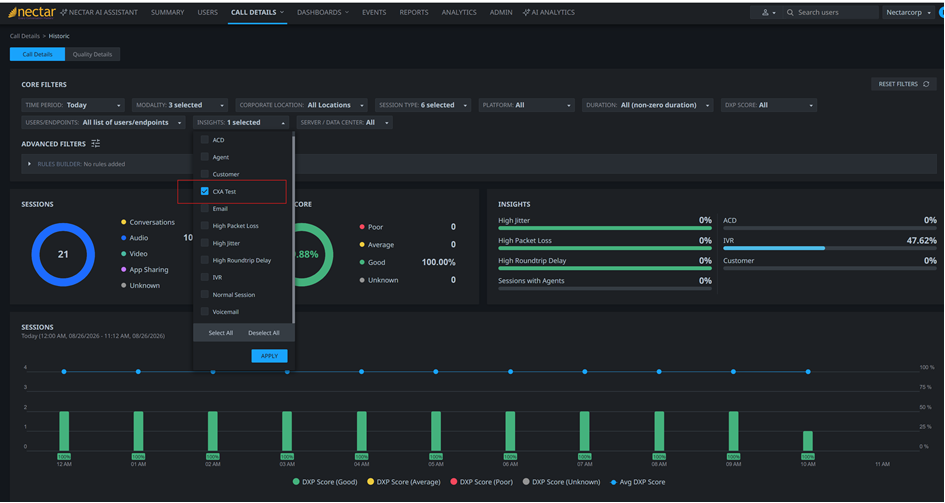
Customers running both Nectar CX Assurance and Nectar DXP no longer have to work across two tools. CX Assurance events, test results, and insights now live directly inside DXP, in the same place teams already work.
That means synthetic test results sit alongside real user experience, and there’s one alerting path to maintain instead of two. For contact center customers, it’s the start of a single view spanning assurance testing and real-world performance.
Google Meet Monitoring Joins WebRTC Coverage
Google Meet is now covered under DXP’s WebRTC monitoring, alongside our existing platform coverage. It’s a common secondary platform in enterprises standardized on Teams or Zoom, and one that’s historically gone unmonitored, so this extends true end-to-end visibility across the collaboration tools employees actually use.
Auto-Location Builder: Now Available Across Every Platform
Every platform DXP supports can now build its location model automatically. That means faster time-to-value on new deployments and less manual onboarding effort, regardless of which platforms a customer runs.
New Conversation Journey Type for Nectar Diagnostics
A new Conversation Journey type has been introduced for Nectar Diagnostics sessions that have no other platform linked to them, along with a new “Conversation Journey (SIP Only)” session type so these can be filtered directly from the session list.
This closes a visibility gap for SIP-centric and diagnostics-led investigations, ensuring that journeys captured through Nectar Diagnostics are represented consistently rather than being lost between platform-specific views.
Platform Accuracy, User Mapping, and Stability Improvements
R24 also delivers a broad set of accuracy and stability improvements under the hood. User counting is more precise across platforms, so licensed-user and quality reporting better reflect who’s actually using the system, and backend performance and stability upgrades keep DXP reliable as deployments scale. They may seem small additions, but together they make the data DXP presents more accurate and more trustworthy.
What’s Next
Want to see it in action? Let us know. You’ll want to get on board now as this release lays groundwork for what’s next.